Enhancing Kubernetes Workload Management with nOps Visibility UI
Enhancing Kubernetes Workload Management with nOps Visibility UI
Headquarters
San Francisco, California
Founded
2017
Industry
Cloud Management Platform
Company size
51-200
Problem & Solution
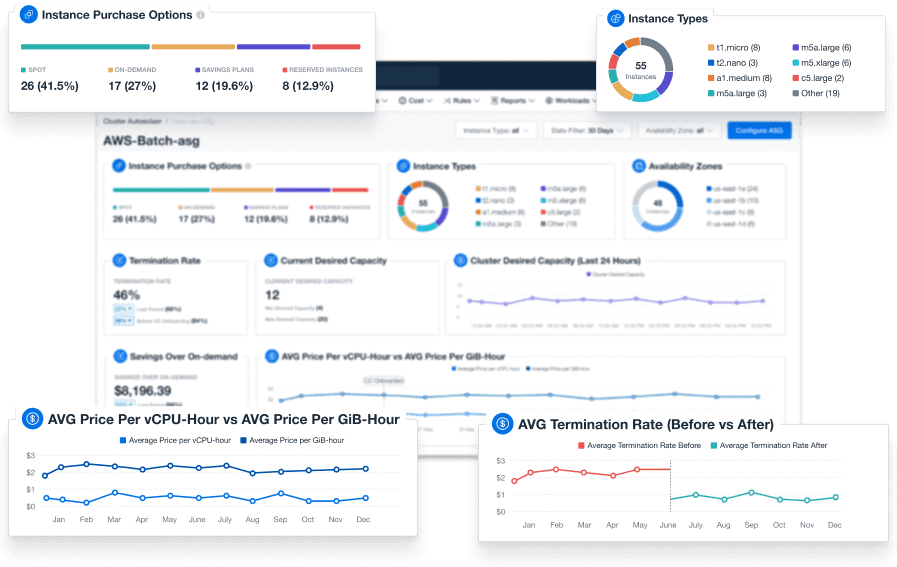
nOps is addressing the challenge of real-time visibility into Kubernetes workloads, which is often complex due to the dynamic nature of cloud environments. The key problems they are trying to solve with their Total Workload Realtime Visibility UI include:
1. Lack of Real-Time Insights – Kubernetes workloads are constantly changing, making it difficult for teams to track resources, costs, and performance in real-time.
2. Inefficient Resource Utilization – Without a clear view of workload usage, teams may over-provision or underutilize resources, leading to unnecessary cloud expenses.
3. Cost Visibility and Optimization – Organizations struggle to map workloads to costs effectively, making it difficult to optimize cloud spending.
4. Operational Complexity – Managing multiple clusters and workloads without a centralized visibility tool increases the complexity of operations.
5. Delayed Troubleshooting – Lack of instant insights makes identifying performance bottlenecks, misconfigurations, or potential failures more time-consuming.
The new UI aims to provide a real-time, centralized, and visual representation of Kubernetes workloads, helping teams make faster, data-driven decisions to improve efficiency, cost management, and operational clarity.
Results
Since the launch of the Visibility UI, nOps customers have reported:
• 30% reduction in cloud costs due to improved resource utilization.
• 50% faster troubleshooting by identifying issues in real-time.
• Increased operational efficiency, enabling teams to focus on innovation instead of firefighting workload issues.
• Enhanced governance & compliance, ensuring workloads adhere to cost and performance policies.
30%
Reduction in cloud costs
50%
Faster troubleshooting
99.2%
Increased operational efficiency
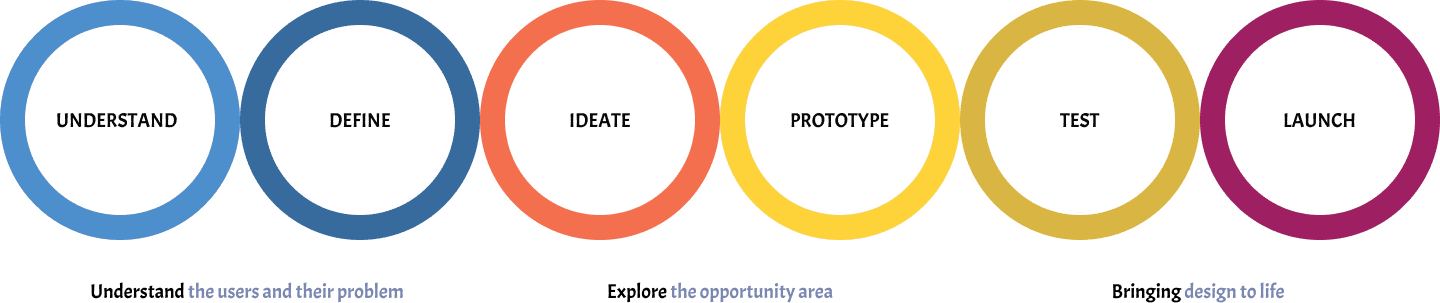
The 6 phases of design thinking we used in every project.
This is the framework I have followed throughout the entire project. Where all stakeholders were aligned at each of the milestones and made decisions on feedback at different stages.
Understand – Research & Problem Discovery
Identify Users & Stakeholders: Who will benefit from the Visibility UI? Likely users include:
• DevOps engineers managing Kubernetes workloads.
• FinOps teams tracking cloud costs.
• Cloud architects optimizing infrastructure.
Gather Insights:
• Conduct interviews or surveys with potential users.
• Analyze existing Kubernetes monitoring tools and their limitations.
• Identify common pain points, such as:
• Lack of real-time visibility into workloads.
• Difficult cost tracking, leading to overspending.
Complex workload management, especially across multiple clusters.
Define Success Metrics:
• What would a successful solution look like?
Examples: Reducing troubleshooting time by 50%, improving cost efficiency by 30%, or enhancing user satisfaction.
Define – Problem Statement
The Define phase is where you take all the insights gathered during the Understand phase and refine them into a clear, actionable problem statement. This step ensures that the team is aligned on what needs to be solved before moving into ideation and prototyping.
Key Actions:
Craft a Problem Statement: Example:
“Kubernetes users lack real-time visibility into workload utilization, leading to inefficient resource allocation, higher cloud costs, and slow issue resolution.”
Set Clear Objectives:
• Provide real-time insights into Kubernetes workloads.
• Help track and optimize cloud costs dynamically.
• Improve workload efficiency and resource allocation.
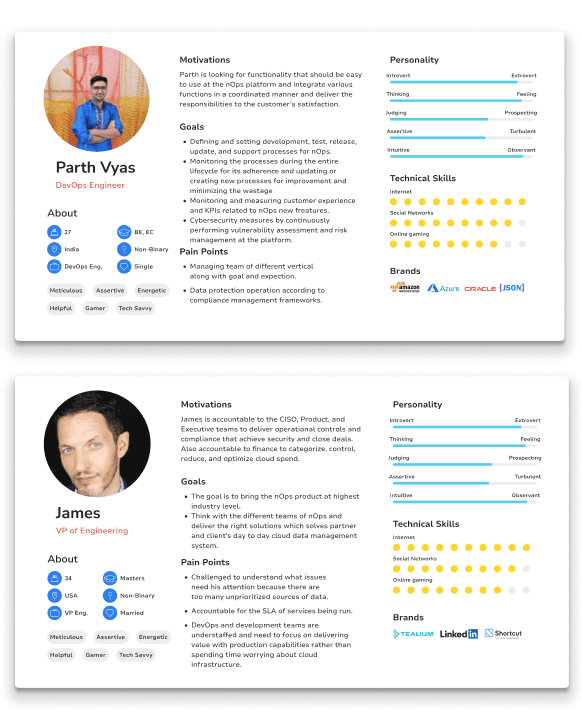
Define Key Personas: Example personas:
• DevOps Engineer: Needs real-time tracking of workload performance.
• FinOps Analyst: Wants to link workloads with costs.
• Cloud Architect: Needs workload insights for scaling decisions.
Ideate – Brainstorming & Conceptualization
This phase is all about generating and refining ideas for the Visibility UI. The goal is to explore different design possibilities, prioritize features, and come up with a solution that effectively addresses the problem statement.
Key Actions:
Explore Different UI Approaches:
• How should workload metrics be displayed? Graphs, dashboards, alerts?
• What data should be surfaced prominently? CPU/memory usage, costs, anomalies?
Collaborate with Users & Stakeholders:
• Conduct a design workshop to gather ideas.
• Sketch low-fidelity wireframes and get early feedback.
Prioritize Features:
• Must-have: Real-time workload tracking, cost mapping, performance alerts.
• Nice-to-have: AI-based recommendations, predictive scaling insights.
Prototype - UI Design & Development
Once you have defined the problem and brainstormed ideas, the next step is to bring your concept to life through prototyping. The goal of this phase is to create a working version of the Visibility UI that users can interact with and test.
Key Actions:
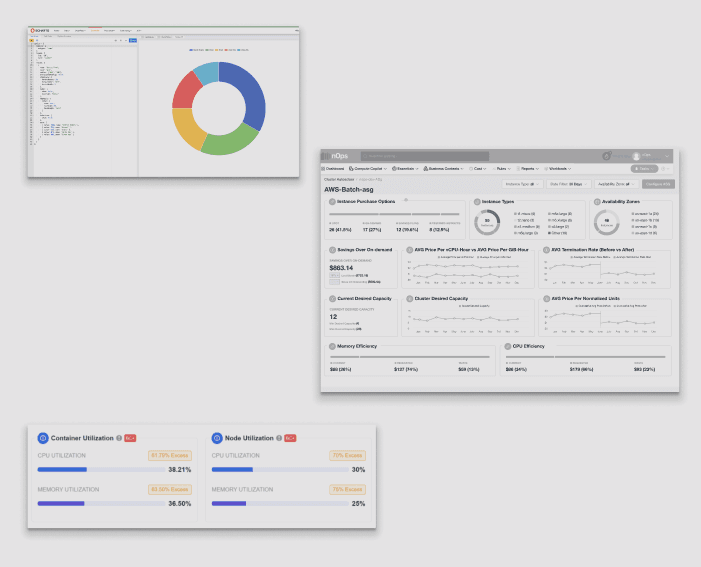
Create Wireframes & Mockups
Before jumping into development, start with low-fidelity wireframes to visualize the structure and layout of the Visibility UI.
Use design tools like:
• Figma
Wireframes should include:
• Navigation & dashboard structure: Where will users find key workload insights?
• Key metrics display: CPU/memory utilization, cost breakdown, workload status.
• Real-time updates section: How will the UI reflect live data?
Develop an Interactive Prototype
• Once wireframes are approved, convert them into an interactive prototype that mimics real functionality.
What an interactive prototype includes:
• Clickable UI elements (buttons, tabs, dropdowns).
• Simulated data to showcase workload performance.
• Workflow interactions (e.g., clicking a workload shows cost breakdown).
Tools for prototyping:
• Figma (has interactive prototyping features).
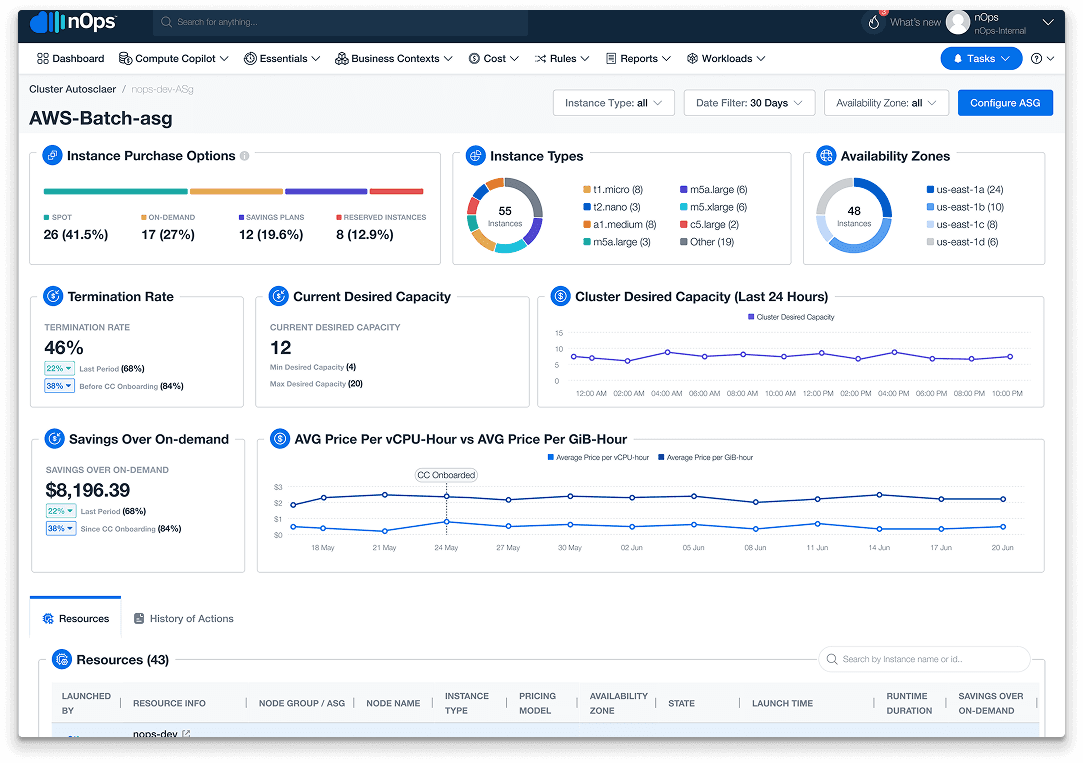
Ensure Real-time Data Visualization
Since the Visibility UI deals with live Kubernetes workloads, the UI must display data dynamically.
Decide how to show real-time data:
• Use graphs, heatmaps, and charts for workload usage.
• Implement alert notifications for performance issues.
• Design a timeline view of resource consumption.
• Example:
If a Kubernetes cluster is over-provisioned, the UI should highlight this with:
✅ Color coding (Red = Overused, Green = Optimal)
✅ Suggested cost-saving actions
Test – User Feedback & Iteration
The Testing phase is crucial to ensure that the Visibility UI is intuitive, effective, and meets user needs. This step involves collecting user feedback, identifying pain points, and making iterative improvements before the final launch.
Key Actions:
Conduct Usability Tests
• Observe how users navigate the UI.
I• dentify points of confusion or inefficiency.
• Test if users can easily access real-time workload insights.
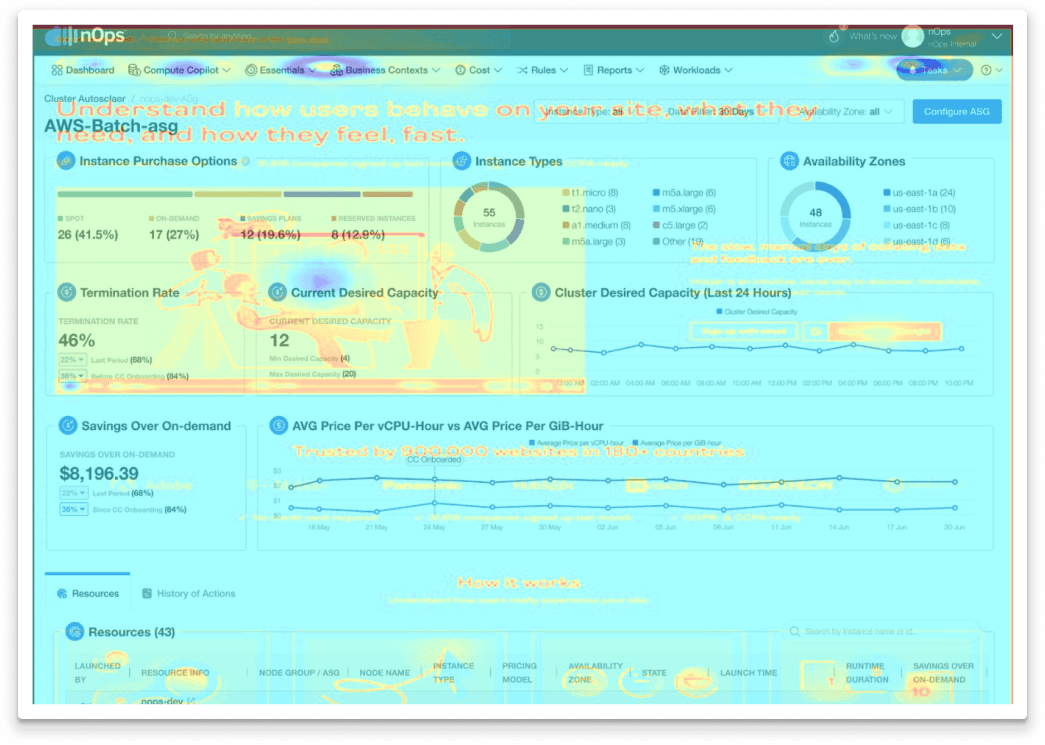
Use Hotjar for Heat Maps
• Track User Behavior: See where users click, scroll, and engage most within the Visibility UI.
• Identify Usability Issues: If users hesitate or avoid key areas, it may indicate a UX problem.
• Optimize Layout: Use heat map insights to rearrange elements for better engagement.
Collect Data with Pendo
• User Flow Analysis: Understand how users interact with different features.
• eature Adoption Tracking: Identify which features users rely on most and which are underutilized.
• Survey & Feedback Collection: Gather qualitative feedback from users directly within the UI.
Analyze Feedback & Identify Pain Points
• Cross-reference Hotjar heat maps with Pendo user flow data to find patterns.
• Identify drop-off points where users struggle or disengage.
• Collect direct feedback to uncover missing features or confusing elements.
Iterate & Improve
• Make design adjustments based on heat map insights (e.g., repositioning buttons, improving navigation).
• Enhance usability based on Pendo’s feature engagement metrics (e.g., simplifying complex interactions).
• Validate changes with a second round of testing before deployment.
Launch – Deployment & Optimization
This is the final stage of the design thinking process, where the Visibility UI is rolled out to users, its performance is monitored, and continuous improvements are made based on real-world usage.
Key Actions:
Go Live with a Beta Launch
• Instead of a full-scale rollout, start with a beta version.
• Select a group of early adopters (DevOps, FinOps teams, cloud architects) to test it.
• Gather initial user reactions and feedback before a wider release.
Monitor Performance & User Adoption
• Track key performance indicators (KPIs), such as:
• Workload efficiency improvement: Are users able to optimize Kubernetes resources better?
• Cost savings: Has the UI helped in reducing unnecessary cloud expenses?
• Troubleshooting time reduction: Are issues being identified and resolved faster?
• User engagement: Are users actively utilizing the UI?
• Use tools like Hotjar, Pendo, or Google Analytics to analyze user behavior.
Gather Continuous Feedback
• Conduct follow-up surveys & interviews to understand user experience.
• Encourage users to report issues, pain points, and missing features.
• Monitor support tickets and usage logs for potential usability problems.
Optimize & Iterate
• Fix usability issues identified in beta testing.
• Enhance the UI based on real-world usage.
• Refine automation & AI-driven insights to improve workload recommendations.
Plan for Full-Scale Deployment
• Once beta testing confirms success, scale the release to all users.
• Provide training materials & documentation to ensure smooth adoption.
• Work with marketing & customer success teams to drive awareness.
Conclusion
The nOps Visibility UI has proven to be a powerful solution for tackling the growing complexity of Kubernetes workload management. By delivering real-time visibility, actionable insights, and cost optimization opportunities, it empowers DevOps and FinOps teams to make informed decisions faster. The seamless integration with user behavior tools like Hotjar and Pendo further ensures that the product evolves based on actual usage patterns. As organizations continue to scale in the cloud, solutions like Visibility UI are no longer optional—they are essential for maintaining operational excellence, financial control, and long-term infrastructure sustainability.
Headquarters
San Francisco, California
Founded
2017
Industry
Cloud Management Platform
Company size
51-200
Problem & Solution
nOps is addressing the challenge of real-time visibility into Kubernetes workloads, which is often complex due to the dynamic nature of cloud environments. The key problems they are trying to solve with their Total Workload Realtime Visibility UI include:
1. Lack of Real-Time Insights – Kubernetes workloads are constantly changing, making it difficult for teams to track resources, costs, and performance in real-time.
2. Inefficient Resource Utilization – Without a clear view of workload usage, teams may over-provision or underutilize resources, leading to unnecessary cloud expenses.
3. Cost Visibility and Optimization – Organizations struggle to map workloads to costs effectively, making it difficult to optimize cloud spending.
4. Operational Complexity – Managing multiple clusters and workloads without a centralized visibility tool increases the complexity of operations.
5. Delayed Troubleshooting – Lack of instant insights makes identifying performance bottlenecks, misconfigurations, or potential failures more time-consuming.
The new UI aims to provide a real-time, centralized, and visual representation of Kubernetes workloads, helping teams make faster, data-driven decisions to improve efficiency, cost management, and operational clarity.
Results
Since the launch of the Visibility UI, nOps customers have reported:
• 30% reduction in cloud costs due to improved resource utilization.
• 50% faster troubleshooting by identifying issues in real-time.
• Increased operational efficiency, enabling teams to focus on innovation instead of firefighting workload issues.
• Enhanced governance & compliance, ensuring workloads adhere to cost and performance policies.
30%
Reduction in cloud costs
50%
Faster troubleshooting
99.2%
Increased operational efficiency
The 6 phases of design thinking we used in every project.
This is the framework I have followed throughout the entire project. Where all stakeholders were aligned at each of the milestones and made decisions on feedback at different stages.
Understand – Research & Problem Discovery
Identify Users & Stakeholders: Who will benefit from the Visibility UI? Likely users include:
• DevOps engineers managing Kubernetes workloads.
• FinOps teams tracking cloud costs.
• Cloud architects optimizing infrastructure.
Gather Insights:
• Conduct interviews or surveys with potential users.
• Analyze existing Kubernetes monitoring tools and their limitations.
• Identify common pain points, such as:
• Lack of real-time visibility into workloads.
• Difficult cost tracking, leading to overspending.
Complex workload management, especially across multiple clusters.
Define Success Metrics:
• What would a successful solution look like?
Examples: Reducing troubleshooting time by 50%, improving cost efficiency by 30%, or enhancing user satisfaction.
Define – Problem Statement
The Define phase is where you take all the insights gathered during the Understand phase and refine them into a clear, actionable problem statement. This step ensures that the team is aligned on what needs to be solved before moving into ideation and prototyping.
Key Actions:
Craft a Problem Statement: Example:
“Kubernetes users lack real-time visibility into workload utilization, leading to inefficient resource allocation, higher cloud costs, and slow issue resolution.”
Set Clear Objectives:
• Provide real-time insights into Kubernetes workloads.
• Help track and optimize cloud costs dynamically.
• Improve workload efficiency and resource allocation.
Define Key Personas: Example personas:
• DevOps Engineer: Needs real-time tracking of workload performance.
• FinOps Analyst: Wants to link workloads with costs.
• Cloud Architect: Needs workload insights for scaling decisions.
Ideate – Brainstorming & Conceptualization
This phase is all about generating and refining ideas for the Visibility UI. The goal is to explore different design possibilities, prioritize features, and come up with a solution that effectively addresses the problem statement.
Key Actions:
Explore Different UI Approaches:
• How should workload metrics be displayed? Graphs, dashboards, alerts?
• What data should be surfaced prominently? CPU/memory usage, costs, anomalies?
Collaborate with Users & Stakeholders:
• Conduct a design workshop to gather ideas.
• Sketch low-fidelity wireframes and get early feedback.
Prioritize Features:
• Must-have: Real-time workload tracking, cost mapping, performance alerts.
• Nice-to-have: AI-based recommendations, predictive scaling insights.
Prototype - UI Design & Development
Once you have defined the problem and brainstormed ideas, the next step is to bring your concept to life through prototyping. The goal of this phase is to create a working version of the Visibility UI that users can interact with and test.
Key Actions:
Create Wireframes & Mockups
Before jumping into development, start with low-fidelity wireframes to visualize the structure and layout of the Visibility UI.
Use design tools like:
• Figma
Wireframes should include:
• Navigation & dashboard structure: Where will users find key workload insights?
• Key metrics display: CPU/memory utilization, cost breakdown, workload status.
• Real-time updates section: How will the UI reflect live data?
Develop an Interactive Prototype
• Once wireframes are approved, convert them into an interactive prototype that mimics real functionality.
What an interactive prototype includes:
• Clickable UI elements (buttons, tabs, dropdowns).
• Simulated data to showcase workload performance.
• Workflow interactions (e.g., clicking a workload shows cost breakdown).
Tools for prototyping:
• Figma (has interactive prototyping features).
Ensure Real-time Data Visualization
Since the Visibility UI deals with live Kubernetes workloads, the UI must display data dynamically.
Decide how to show real-time data:
• Use graphs, heatmaps, and charts for workload usage.
• Implement alert notifications for performance issues.
• Design a timeline view of resource consumption.
• Example:
If a Kubernetes cluster is over-provisioned, the UI should highlight this with:
✅ Color coding (Red = Overused, Green = Optimal)
✅ Suggested cost-saving actions
Test – User Feedback & Iteration
The Testing phase is crucial to ensure that the Visibility UI is intuitive, effective, and meets user needs. This step involves collecting user feedback, identifying pain points, and making iterative improvements before the final launch.
Key Actions:
Conduct Usability Tests
Observe how users navigate the UI.
Identify points of confusion or inefficiency.
Test if users can easily access real-time workload insights.
Use Hotjar for Heat Maps
• Track User Behavior: See where users click, scroll, and engage most within the Visibility UI.
• Identify Usability Issues: If users hesitate or avoid key areas, it may indicate a UX problem.
• Optimize Layout: Use heat map insights to rearrange elements for better engagement.
Collect Data with Pendo
• User Flow Analysis: Understand how users interact with different features.
• eature Adoption Tracking: Identify which features users rely on most and which are underutilized.
• Survey & Feedback Collection: Gather qualitative feedback from users directly within the UI.
Analyze Feedback & Identify Pain Points
• Cross-reference Hotjar heat maps with Pendo user flow data to find patterns.
• Identify drop-off points where users struggle or disengage.
• Collect direct feedback to uncover missing features or confusing elements.
Iterate & Improve
• Make design adjustments based on heat map insights (e.g., repositioning buttons, improving navigation).
• Enhance usability based on Pendo’s feature engagement metrics (e.g., simplifying complex interactions).
• Validate changes with a second round of testing before deployment.
Launch – Deployment & Optimization
This is the final stage of the design thinking process, where the Visibility UI is rolled out to users, its performance is monitored, and continuous improvements are made based on real-world usage.
Key Actions:
Go Live with a Beta Launch
• Instead of a full-scale rollout, start with a beta version.
• Select a group of early adopters (DevOps, FinOps teams, cloud architects) to test it.
• Gather initial user reactions and feedback before a wider release.
Monitor Performance & User Adoption
• Track key performance indicators (KPIs), such as:
• Workload efficiency improvement: Are users able to optimize Kubernetes resources better?
• Cost savings: Has the UI helped in reducing unnecessary cloud expenses?
• Troubleshooting time reduction: Are issues being identified and resolved faster?
• User engagement: Are users actively utilizing the UI?
• Use tools like Hotjar, Pendo, or Google Analytics to analyze user behavior.
Gather Continuous Feedback
• Conduct follow-up surveys & interviews to understand user experience.
• Encourage users to report issues, pain points, and missing features.
• Monitor support tickets and usage logs for potential usability problems.
Optimize & Iterate
• Fix usability issues identified in beta testing.
• Enhance the UI based on real-world usage.
• Refine automation & AI-driven insights to improve workload recommendations.
Plan for Full-Scale Deployment
• Once beta testing confirms success, scale the release to all users.
• Provide training materials & documentation to ensure smooth adoption.
• Work with marketing & customer success teams to drive awareness.
Conclusion
The nOps Visibility UI has proven to be a powerful solution for tackling the growing complexity of Kubernetes workload management. By delivering real-time visibility, actionable insights, and cost optimization opportunities, it empowers DevOps and FinOps teams to make informed decisions faster. The seamless integration with user behavior tools like Hotjar and Pendo further ensures that the product evolves based on actual usage patterns. As organizations continue to scale in the cloud, solutions like Visibility UI are no longer optional—they are essential for maintaining operational excellence, financial control, and long-term infrastructure sustainability.